Stability Diagram with Pressure as a Variable
This section describes how to perform Point (0D), Line (1D), and Section (2D) calculations when gas pressure is one of the variables. For such calculations, the gas phase must be included in the database used for the calculation.
2D Calculation
A 2D diagram that shows the stability of condensed phases as a function composition or temperature (one axis) and pressure (the other axis), or both axes with the partial pressure of gas species, is commonly referred to as a stability diagram or predominance diagram. Here, the Fe-Cr-O system is used as an example to demonstrate how to calculate a stability diagram.
-
Go to the PanPhaseDiagram menu bar and select Section Calculation or click the
 button on the tool bar.
 -
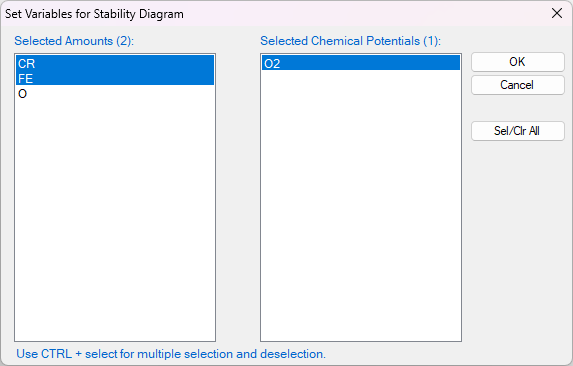
Select the "Stability" as shown in Figure 1(a), In the pop-up window "Set Variable for Stability Diagram", select Cr and Fe as metal alloying components, and O2 as the gas species for chemical potentials, as illustrated in Figure 1(b).
-
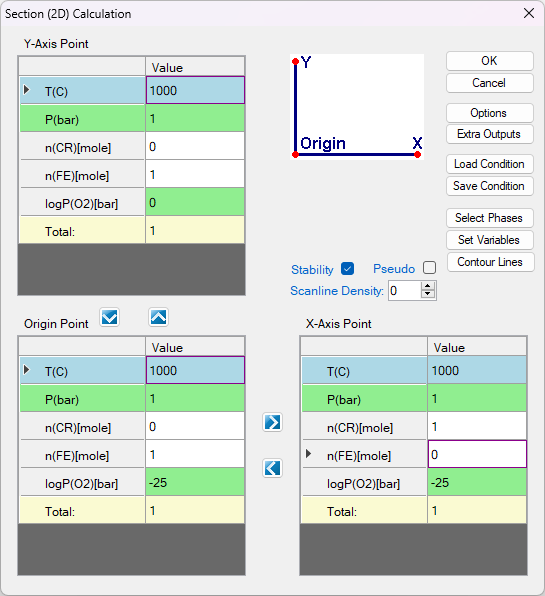
Set the calculation conditions at a fixed temperature of 1000 °C and a total pressure of 1 bar. The X-axis is the composition of Cr varying from 0 to 1 mole. The Y-axis is the partial pressure of O2 ranging from 10-25 bar to 1 bar ( Figure 2 ). After setting these parameters, click "OK" to perform the calculation.
-
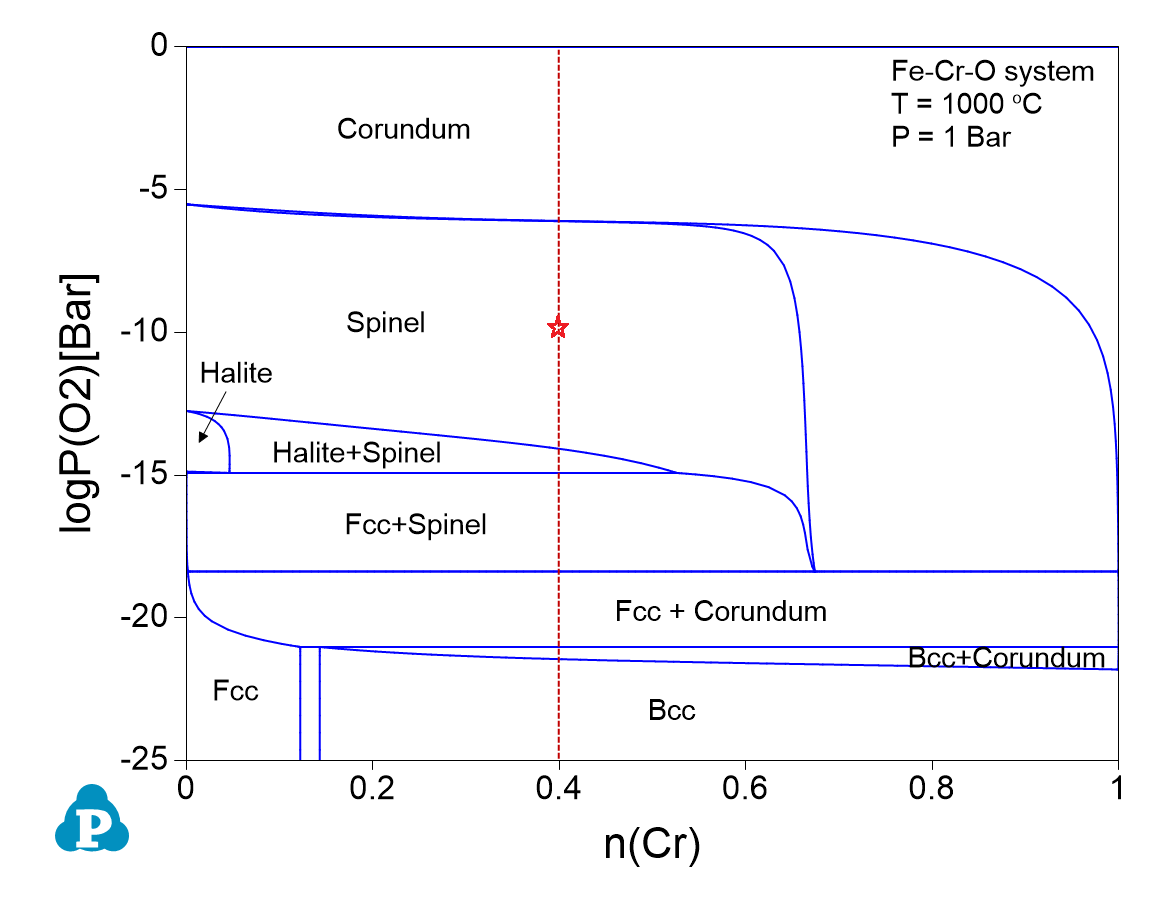
After the calculation is completed, Pandat displays the calculated 2D stability diagram, as shown in Figure 3, with the phase fields labeled afterward.
1D Calculation
The Fe-Cr-O system is used again as an example to demonstrate how to perform a line calculation at fixed composition with varying gas pressure.
-
Navigate to the PanPhaseDiagram menu bar and select Line Calculation or click the
 button on the tool bar.
 -
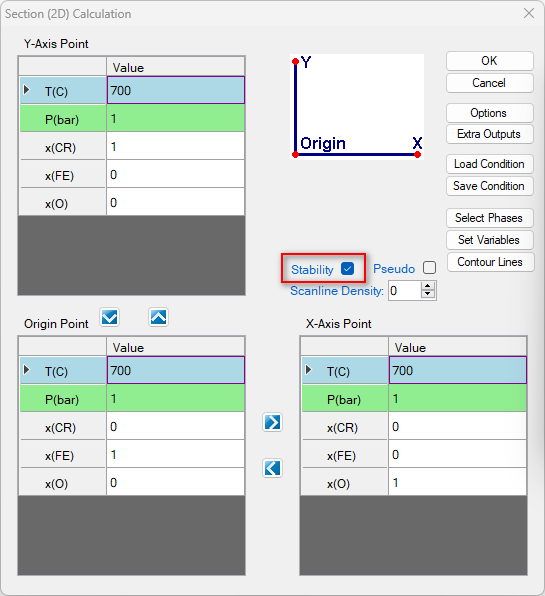
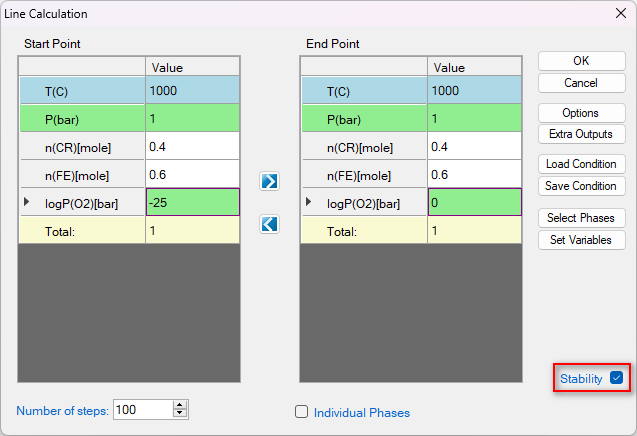
Check the "Stability" box. In the pop-up window "Set Variable for Stability Diagram", select Cr and Fe as the metal alloying components, and O2 as the gas species. Then set up the calculation conditions as shown in Figure 4. This setting sets the temperature at 1000°C, and the total pressure at 1 bar. The composition is set as 0.6Fe-0.4Cr, and the partial pressure of O2 changes from 10-25 bar to 1 bar, i.e. logP(O2) varies from -25 to 0. This setting corresponds to the line calculation indicated by the red line in Figure 3. Click "OK" to perform the calculation.
-
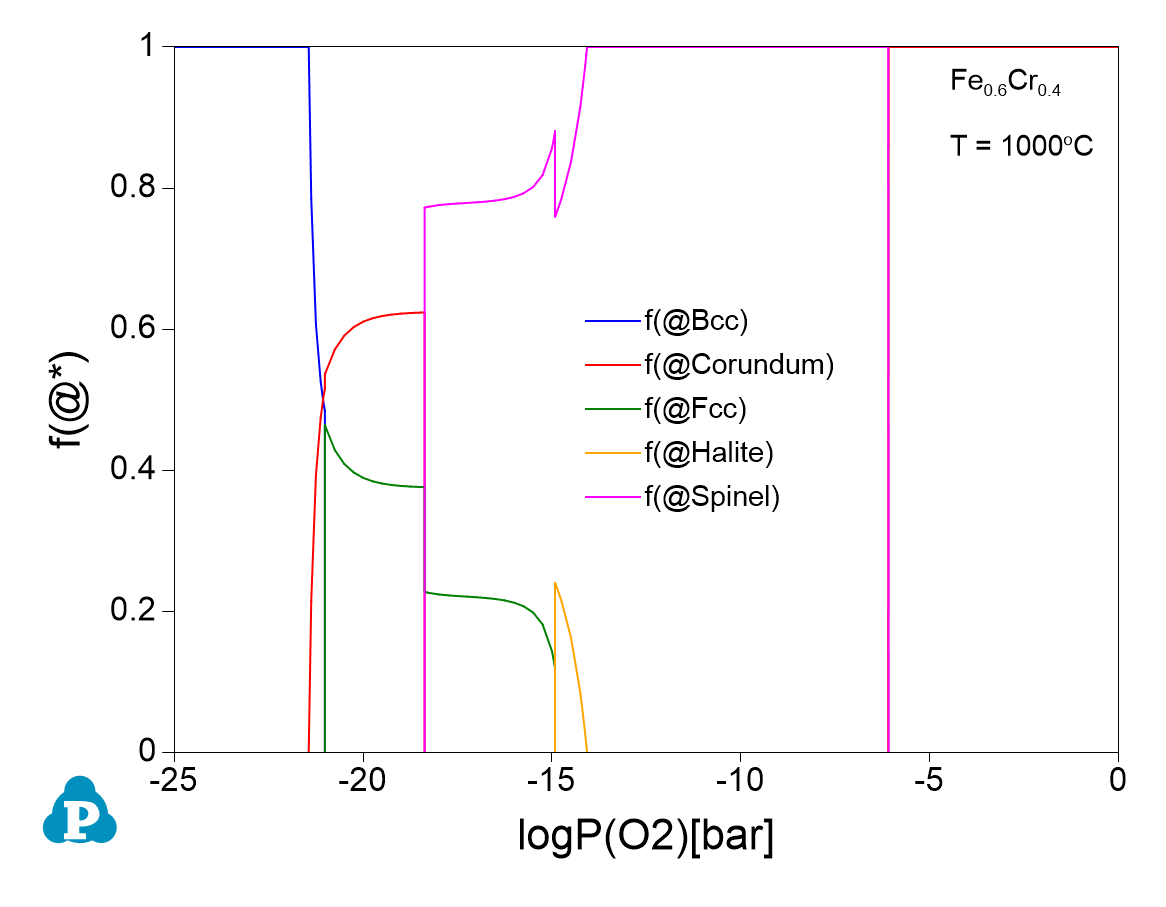
The line calculation result is shown in Figure 5, which displays the fraction of each stable phase as a function of the partial pressure of O2.
0D Calculation
The Fe-Cr-O system is again used as an example for a 0D (point) calculation.
-
Navigate to the PanPhaseDiagram menu bar and select Point Calculation or click the
 button on the tool bar.
 -
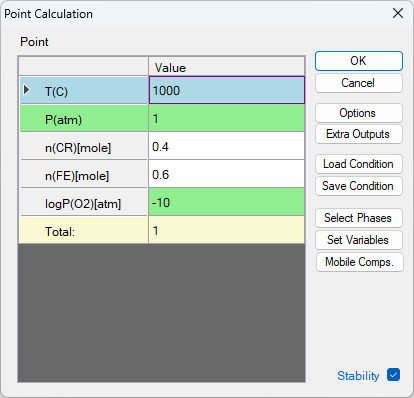
Check the "Stability" box. In the pop-up window "Set Variable for Stability Diagram", select Cr and Fe as the metal alloying components, and O2 as the gas species. Then, set the calculation conditions as shown in Figure 6. This setting sets the temperature at 1000°C, and the total pressure at 1 bar. The composition is set as 0.6mol Fe 0.4mol Cr, and the partial pressure of logP(O2) is -10. This setting corresponds to the “point” indicated by the red cross in Figure 3. Then click "OK" to perform the calculation.
-
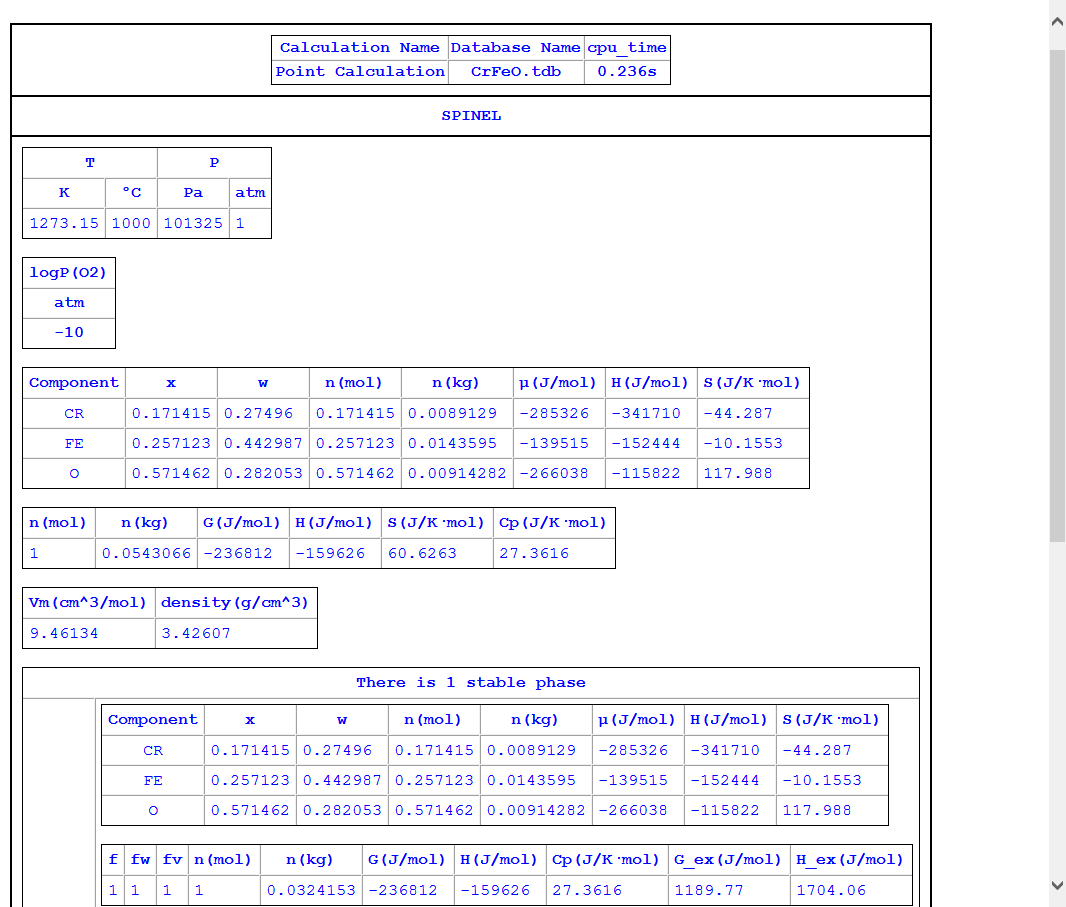
The calculation result is shown in Figure 7, which shows that spinel is the only stable phase under the setting-up conditions of Figure 6.